
plot
Bar, line, area, sparkline, gauge, histogram, heatmap, pie, mirrored and inline bar charts and a world map as terminal cells, in braille, block elements or ASCII, with theme roles in place of colours.
tuios.dev/plot draws charts as terminal cells. It has eleven chart kinds: bar (horizontal and vertical), line, area, sparkline, gauge, histogram, heatmap, pie (a donut or a full disc), mirrored bars, inline bars for table cells, and a world map. It holds no colour and writes no escape sequence. Each cell has a role, and your program picks the colour.
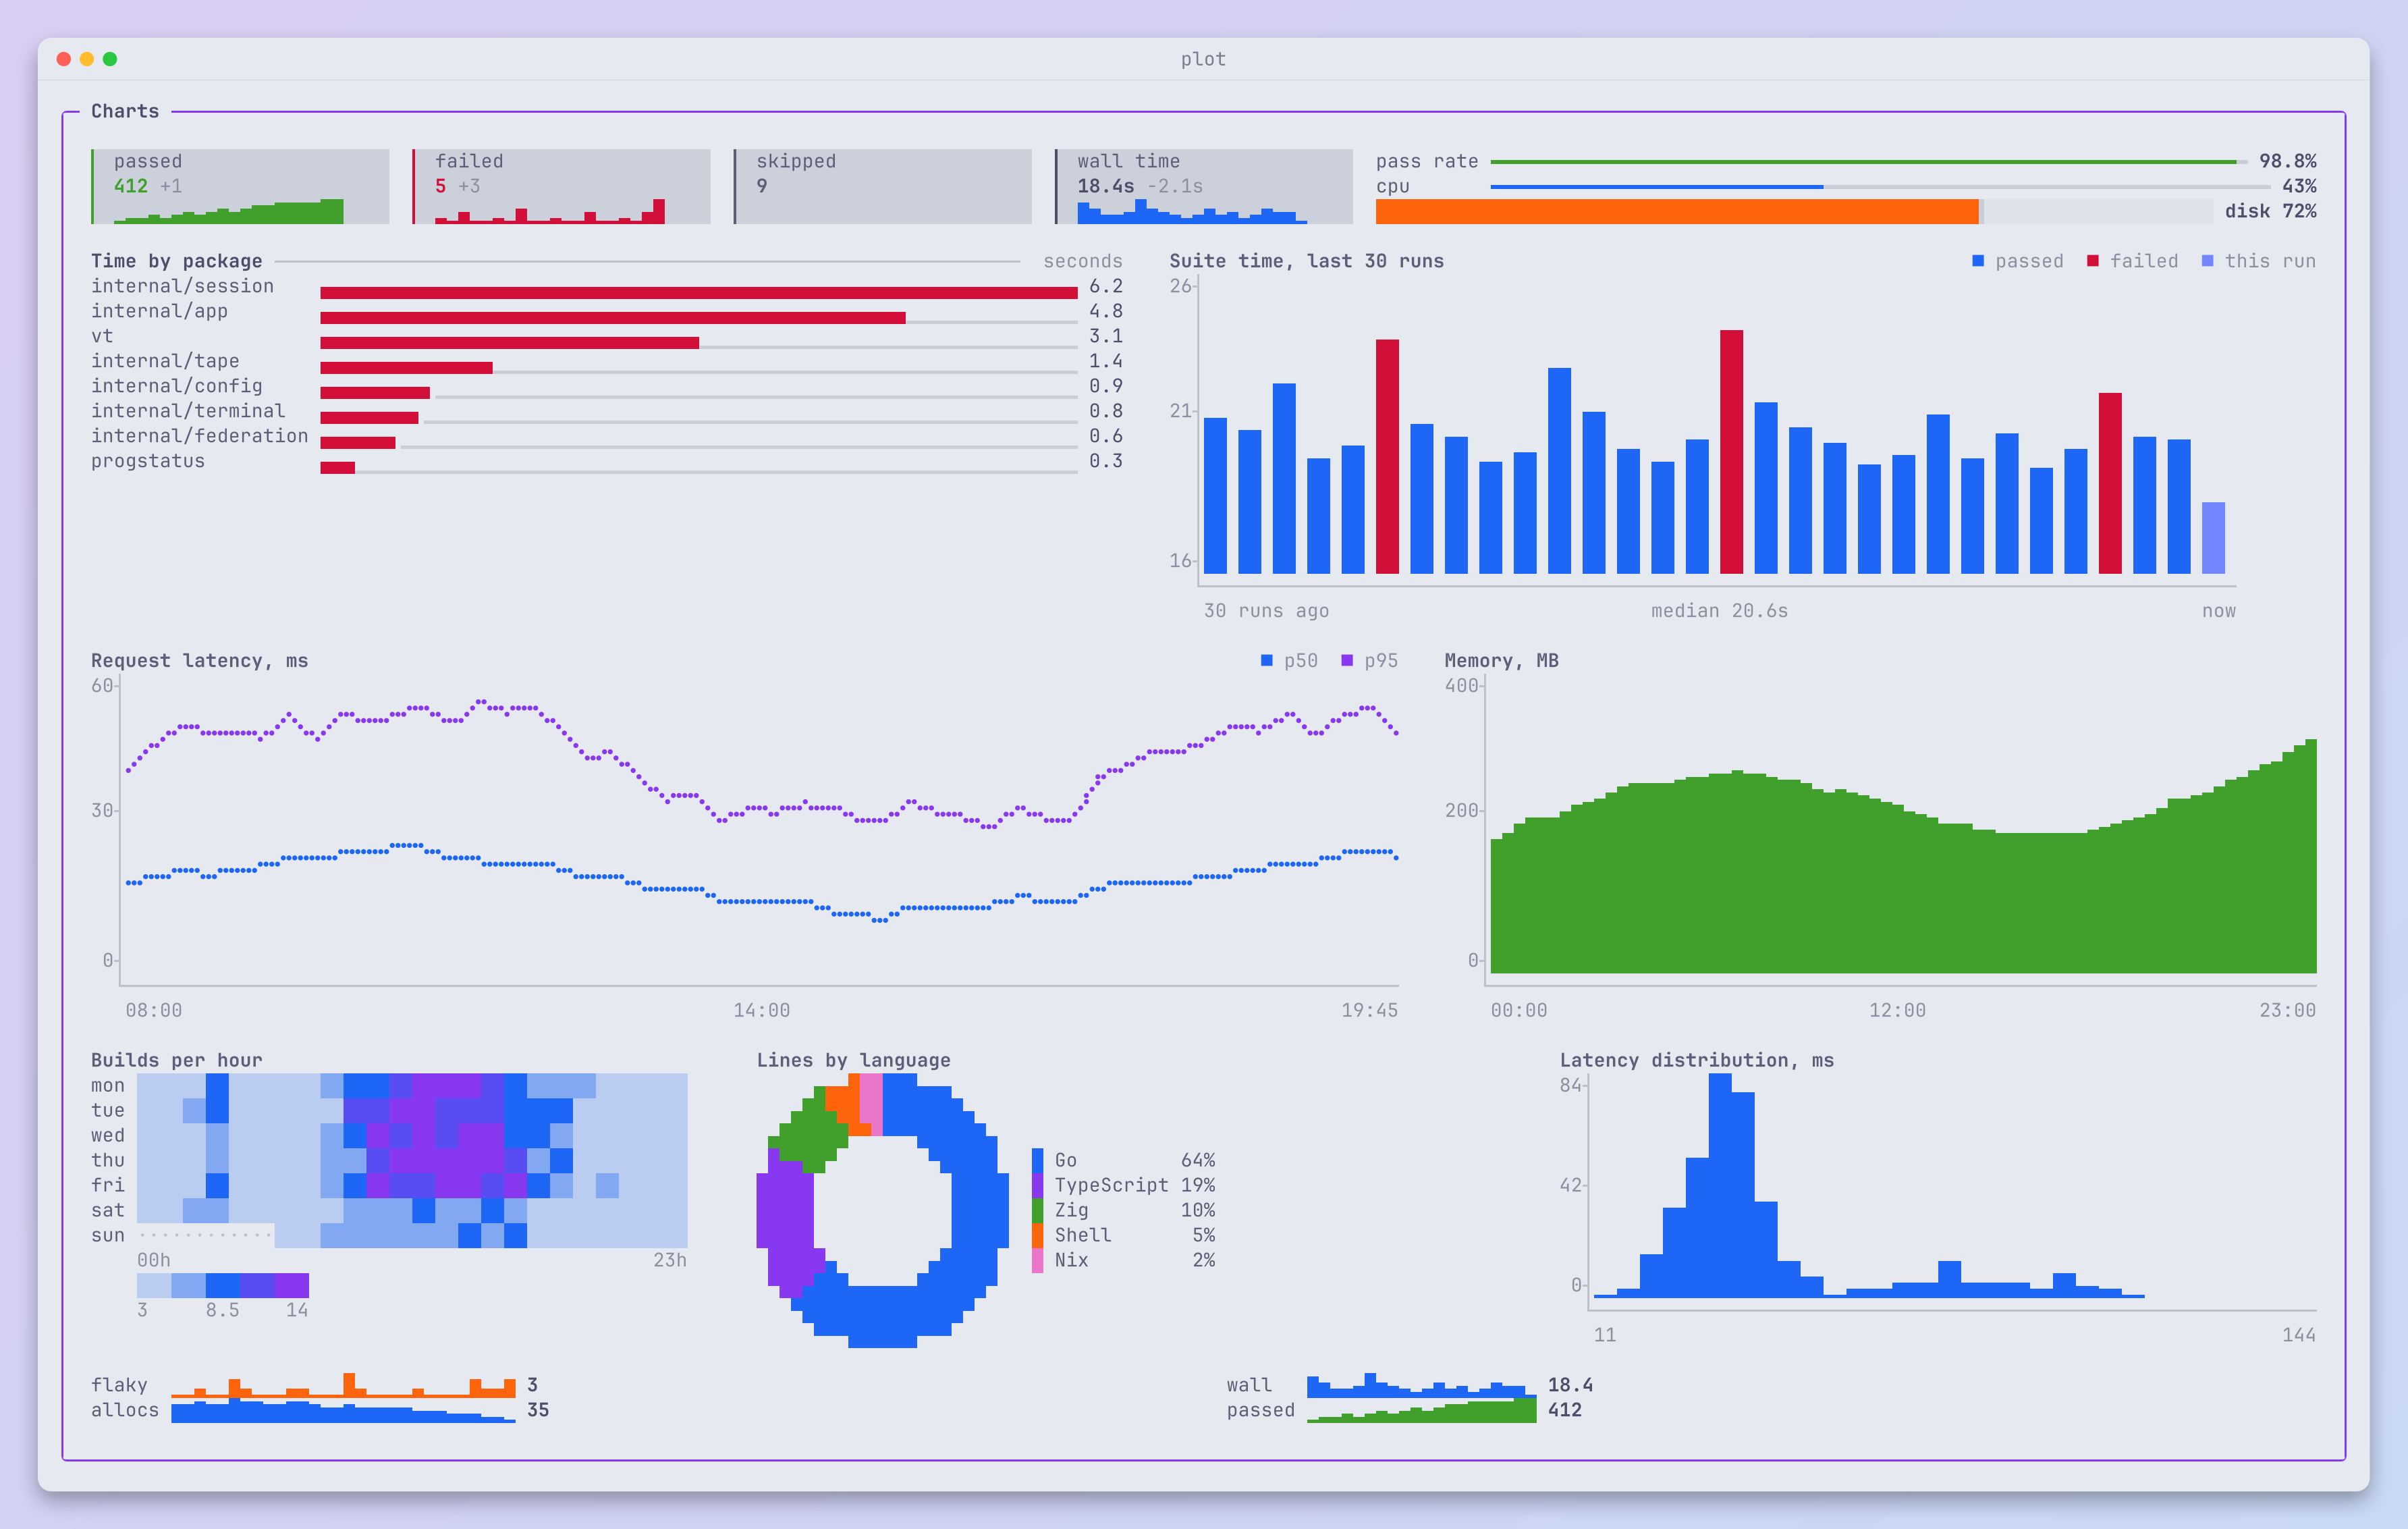
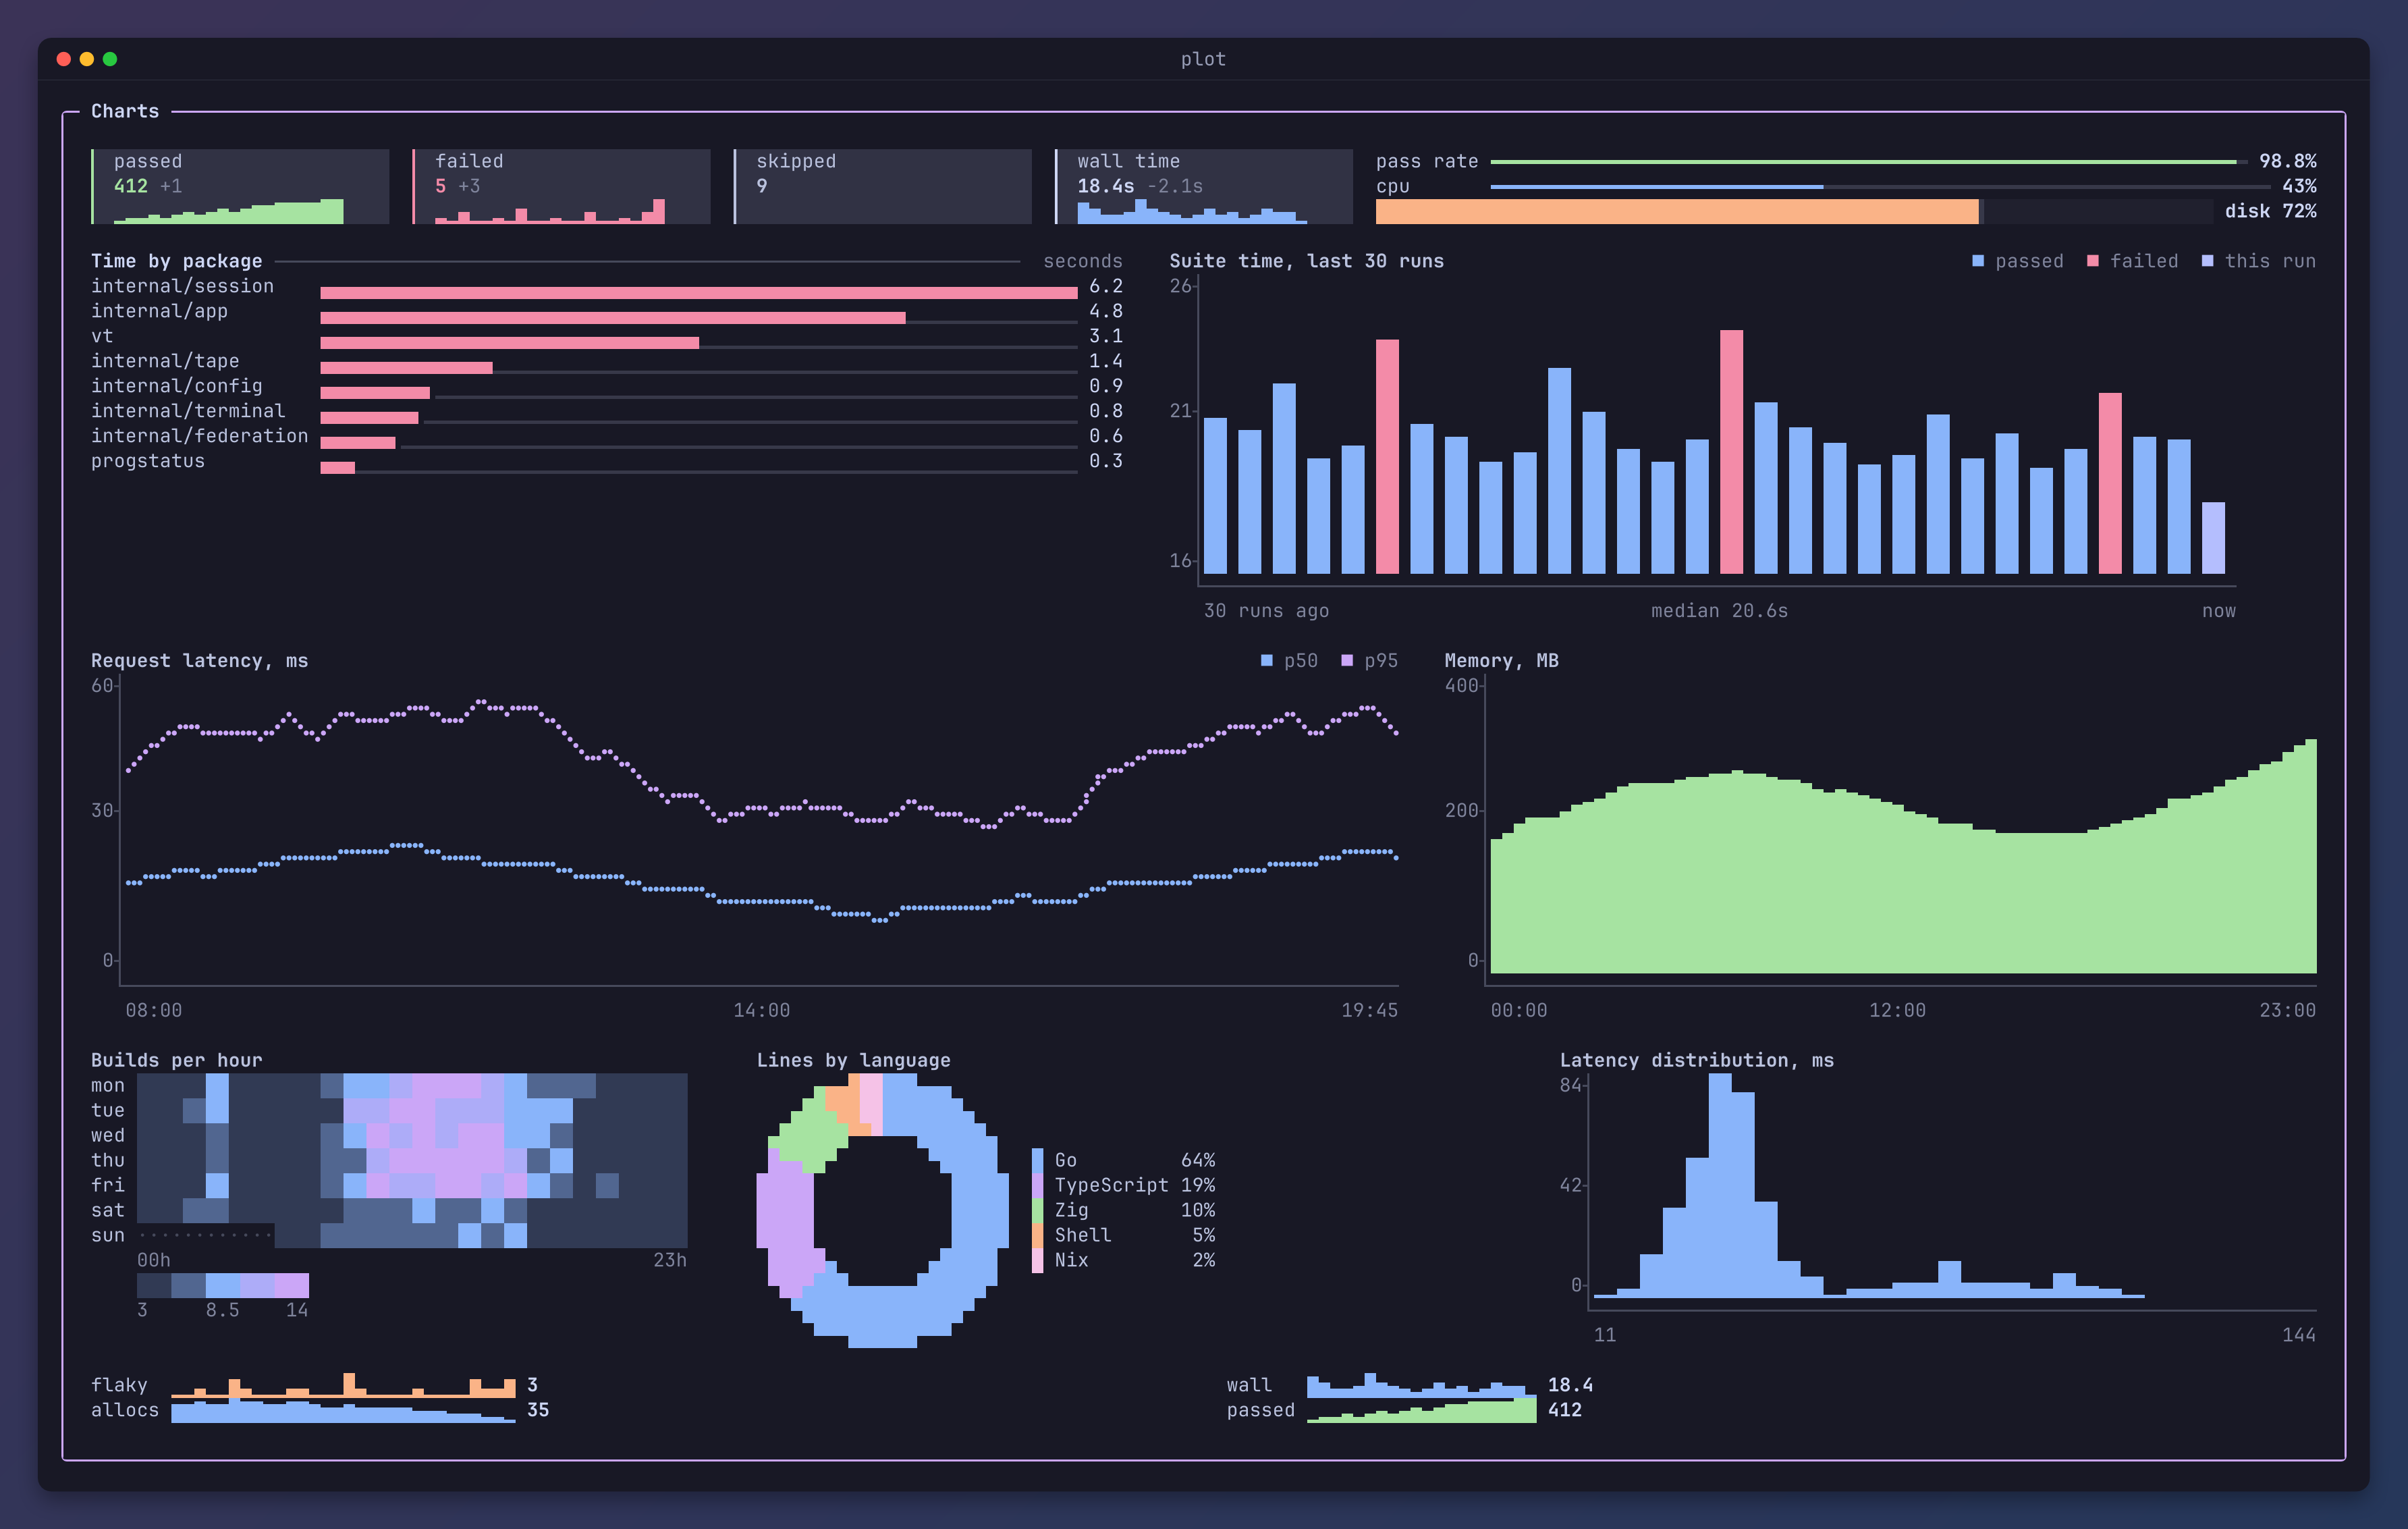
The API reference is on pkg.go.dev.
Quickstart
go get tuios.dev/plotpackage main
import (
"fmt"
"tuios.dev/plot"
)
func main() {
bar := plot.Bar{
Values: []float64{6.2, 4.8, 3.1},
Labels: []string{"session", "app", "vt"},
Horizontal: true,
}
g := bar.Draw(30, 3, plot.Blocks)
// plot holds no colour. Your program maps each role to one, here an
// ANSI colour, so the chart follows the terminal's theme.
sgr := map[plot.Role]string{plot.Series1: "34", plot.Mute: "90"}
for y := 0; y < g.H; y++ {
for x := 0; x < g.W; x++ {
c := g.At(x, y)
if c.Width == 0 {
continue // the second cell of a wide glyph
}
text := c.Text
if text == "" {
text = " "
}
if code, ok := sgr[c.Role]; ok {
text = "\x1b[" + code + "m" + text + "\x1b[0m"
}
fmt.Print(text)
}
fmt.Println()
}
}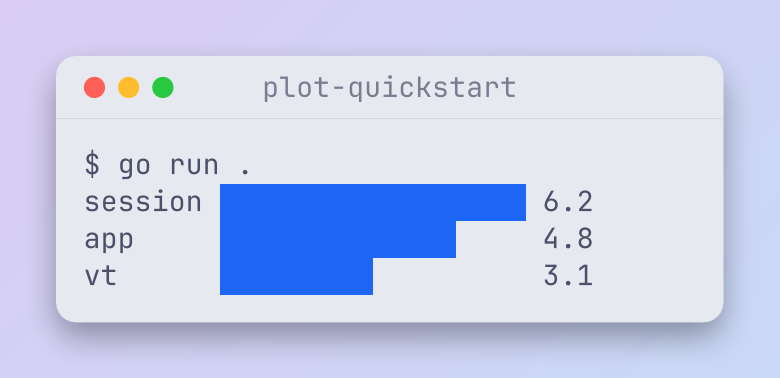
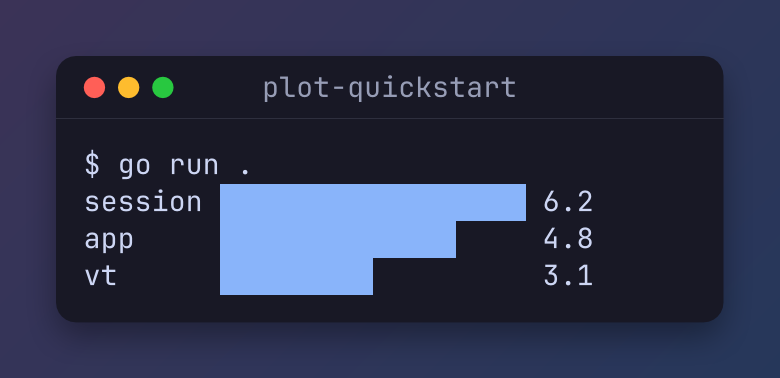
The program maps two roles to ANSI colours, so the chart takes the colours of the terminal's theme.
The tplot command
tplot draws a chart from CSV, TSV, JSON or plain numbers, from a file or standard input. It needs Go 1.25 or newer:
go install tuios.dev/plot/cmd/tplot@latestEach tuios release from v0.11.0 also carries a tplot archive for Linux, macOS, Windows and FreeBSD, on x86_64 and arm64. Download it from the releases page, or install it with a package manager:
brew install --cask gaurav-gosain/tap/tuios-plot   # macOS and Linux
yay -S tuios-plot-bin                              # Arch Linux, from the AUR
printf 'session,6.2\napp,4.8\nvt,3.1\n' | tplot
seq 1 50 | awk '{print sin($1/5)}' | tplot --kind line
tplot --kind pie shares.csv
echo '{"US": 410, "DE": 120, "SG": 14}' | tplot --kind map --log- A text column gives the labels. Each column of numbers is a series. A first row of names is a header.
- JSON can be
[1, 2, 3],{"a": 1},{"rx": [1, 2], "tx": [3, 4]}, rows as arrays, or rows as objects. - Without
--kind, a few labelled values draw as bars, and other data as a line chart. The kinds arebar,column,line,area,spark,hist,heatmap,pie,donut,gaugeandmap. - The colours are the 16 ANSI colours, so the chart takes the colours of the terminal's theme. Without colour, a chart that needs colour to tell its parts apart uses ASCII marks.
tplot -hlists every flag.
The command is tplot, because GNU plotutils already has a plot command. The Homebrew cask and the AUR package keep the library's name.
How it works
- A chart draws into a grid of the size you give it. The grid is always that size, and each row is exactly that wide.
- Each cell holds one grapheme, its width, a role such as
series1ormute, and a background role for half blocks. g.At(x, y)gives one cell.g.String()gives the text with no colours.- Your program maps each role to a colour at the colour depth of the terminal. loom does this with its
Palette.
Chart kinds
Each picture is the code above it. m is the mode, such as plot.Braille. Helpers such as wave make the sample data. The pictures colour the roles with the theme of this site.
Bar
bar := plot.Bar{
	Values:     []float64{6.2, 4.8, 3.1, 1.4, 0.9},
	Labels:     []string{"session", "app", "vt", "tape", "config"},
	Horizontal: true,
	Guide:      true, // a dotted line to the value
}
grid := bar.Draw(48, 5, m)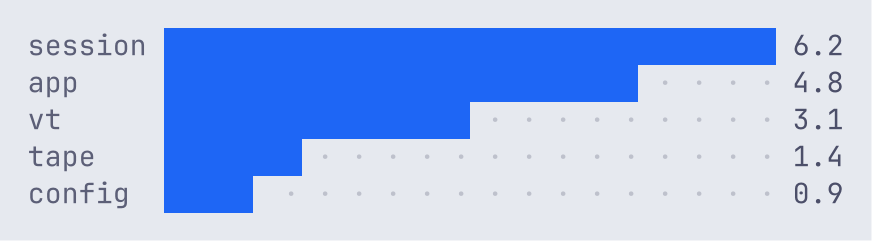
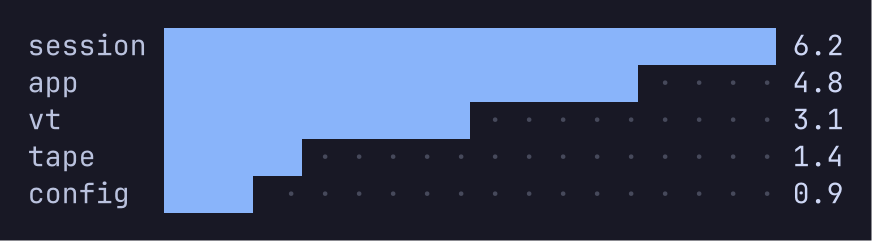
Horizontal bars keep a value column that never clips. The labels give way first.
Columns
cols := plot.Bar{
	Values: []float64{41, 39, 44, 40, 52, 47, 38, 45, 49, 43, 41, 50},
	Labels: []string{"Jan", "Feb", "Mar", "Apr", "May", "Jun", "Jul", "Aug", "Sep", "Oct", "Nov", "Dec"},
	Axis:   true, // tick labels, a base line, and x labels
	Role:   plot.Series2,
}
grid := cols.Draw(48, 9, m)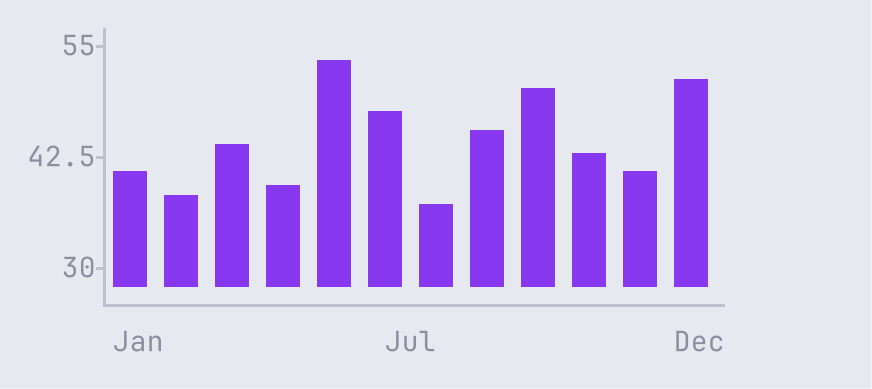
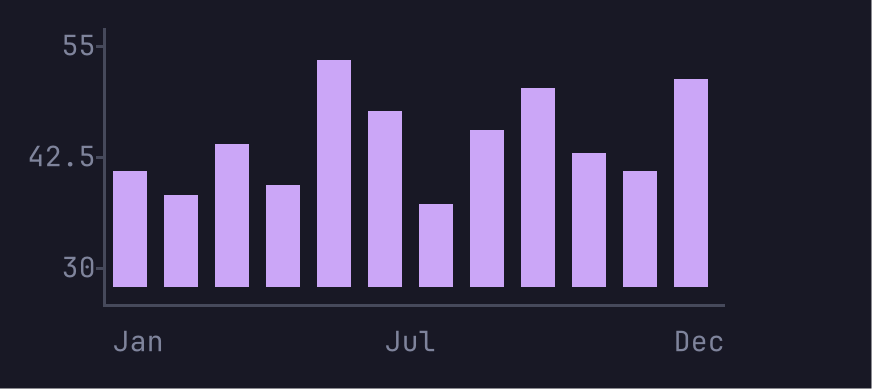
Columns whose values all sit far above zero start from a round base under the smallest value. The axis labels that base, so the chart says where it starts.
Line
line := plot.Line{
	Series: []plot.Series{
		{Name: "p50", Values: wave(40, 20, 4)},
		{Name: "p95", Values: wave(40, 34, 9)},
	},
	Labels: hours(40),
	Axis:   true,
}
// The legend goes on the first row, the chart under it.
grid := plot.NewGrid(56, 11)
plot.DrawLegend(grid, 6, 0, line.Legend(), m)
paste(grid, line.Draw(56, 10, m), 0, 1)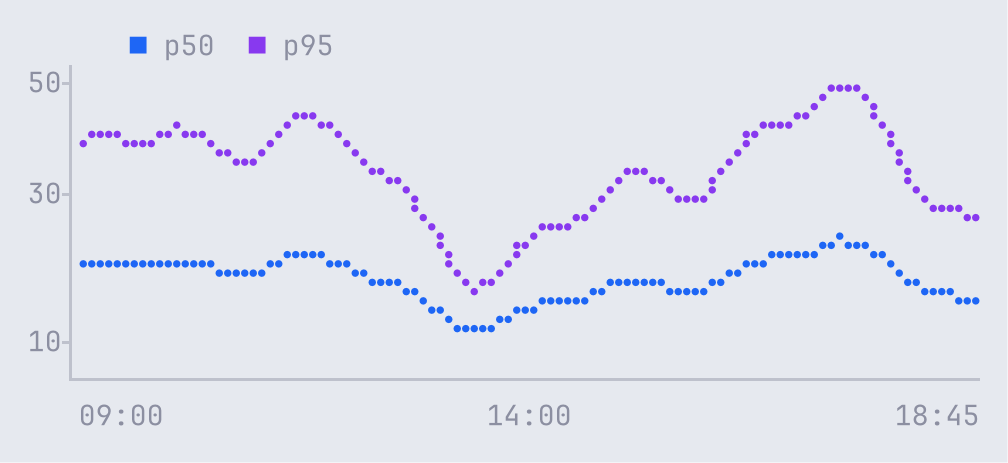
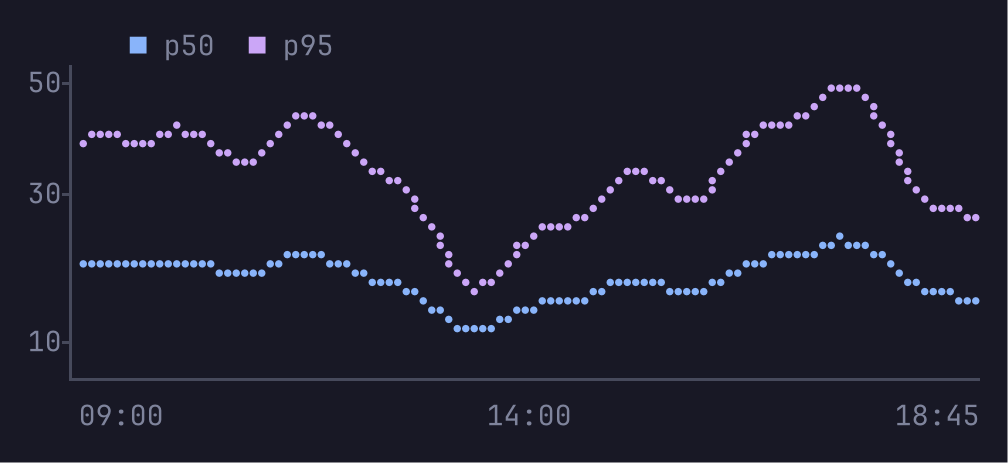
A line with more values than cells is reduced with largest triangle three buckets, which keeps the peaks. Line.Legend returns the legend items, and DrawLegend draws them.
Area
area := plot.Line{
	Series: []plot.Series{{Name: "memory", Values: wave(48, 120, 30), Role: plot.Series3}},
	Fill:   true, // an area chart
	Axis:   true,
	Labels: hours(48),
}
grid := area.Draw(56, 9, m)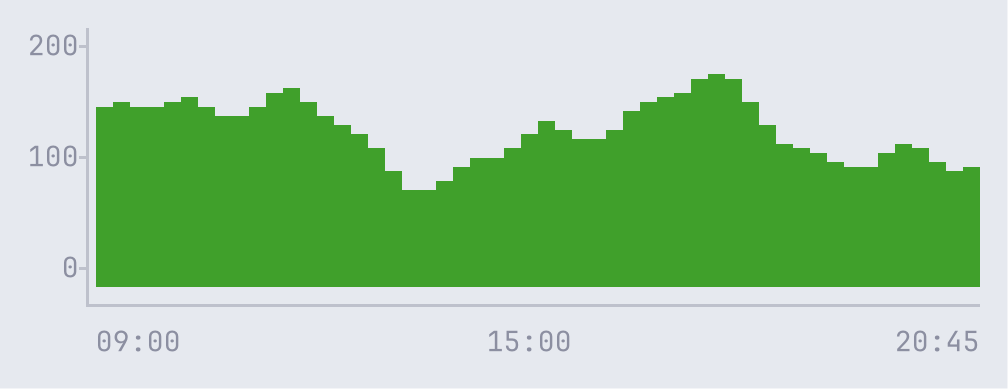
Sparkline
spark := plot.Sparkline{Values: []float64{3, 5, 4, 8, 6, 9, 7, 12, 10, 14, 11, 16, 13, 18, 15, 21}}
grid := spark.Draw(16, 1, m)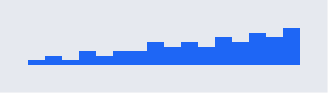
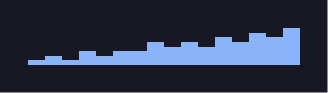
On more than one row, a sparkline is a column chart with no axis.
Gauge
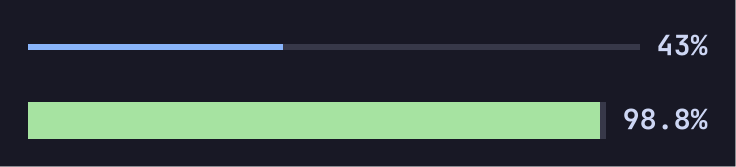
cpu := plot.Gauge{Value: 43, Max: 100}
pass := plot.Gauge{Value: 0.988, Role: plot.Success, Style: plot.GaugeBlocks}
grid := plot.NewGrid(40, 3)
paste(grid, cpu.Draw(40, 1, m), 0, 0)
paste(grid, pass.Draw(40, 1, m), 0, 2)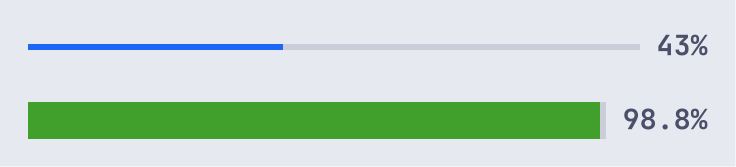
Histogram
hist := plot.Histogram{
	Values: latencies(400), // request times in ms
	Bins:   24,
	Format: func(v float64) string { return fmt.Sprintf("%.0fms", v) },
}
grid := hist.Draw(52, 9, m)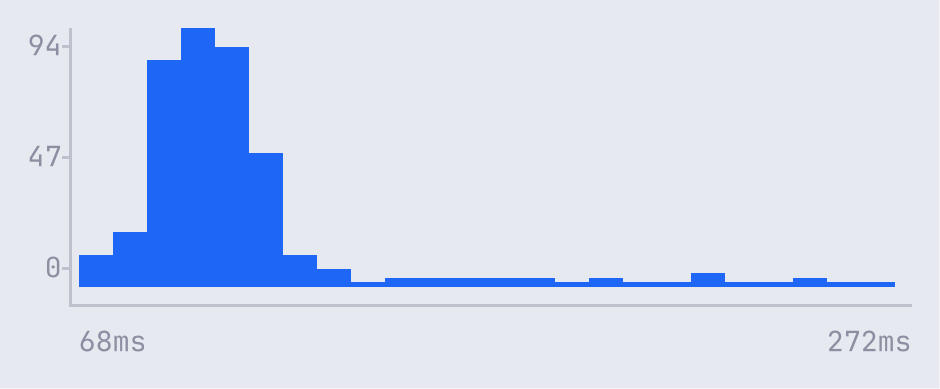
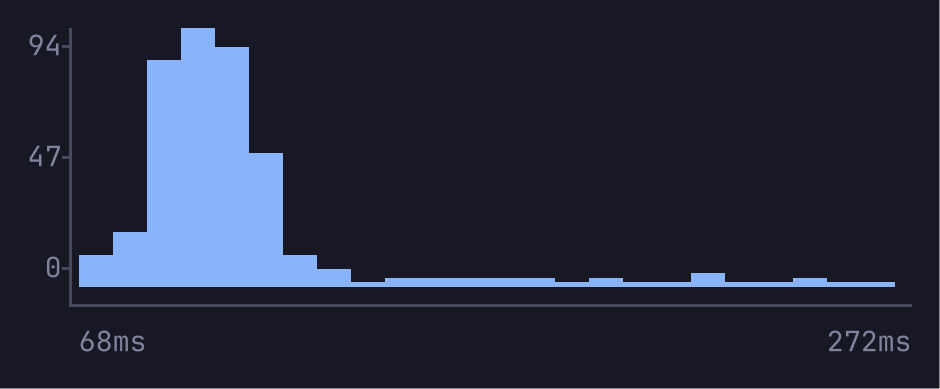
A histogram has at most one bin per cell and 1000 bins.
Heatmap
heat := plot.Heatmap{
	Values:    commits(), // 7 rows of 24 hours
	RowLabels: []string{"Mon", "Tue", "Wed", "Thu", "Fri", "Sat", "Sun"},
	ColLabels: hoursOfDay(), // 00h to 23h
}
grid := heat.Draw(56, 11, m)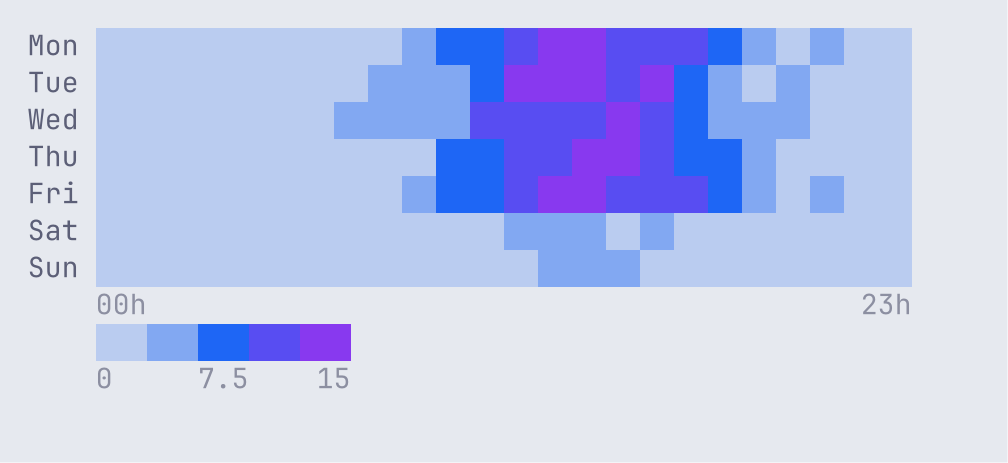
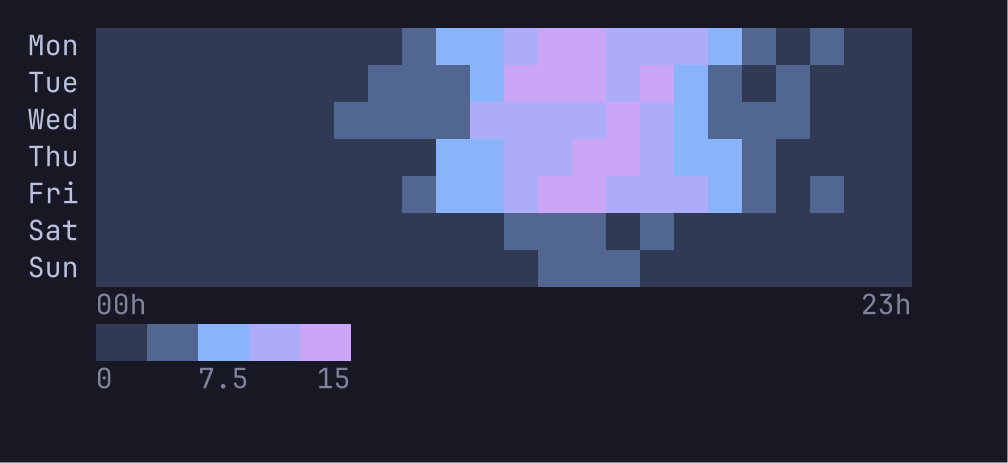
The heat roles heat1 to heat5 are a ramp from low to high. A heatmap uses whole cells, or half blocks when the rows do not fit.
Pie
pie := plot.Pie{
	Values: []float64{900, 240, 120, 60},
	Labels: []string{"Go", "Shell", "TOML", "Nix"},
	Donut:  true,
	Aspect: 2.0, // a cell's height over its width
}
grid := pie.Draw(40, 9, m)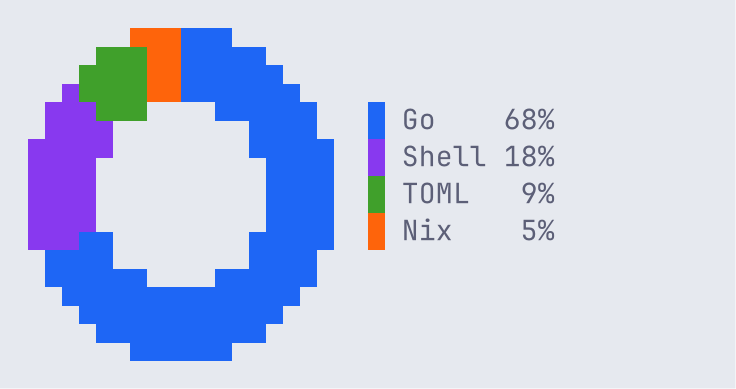
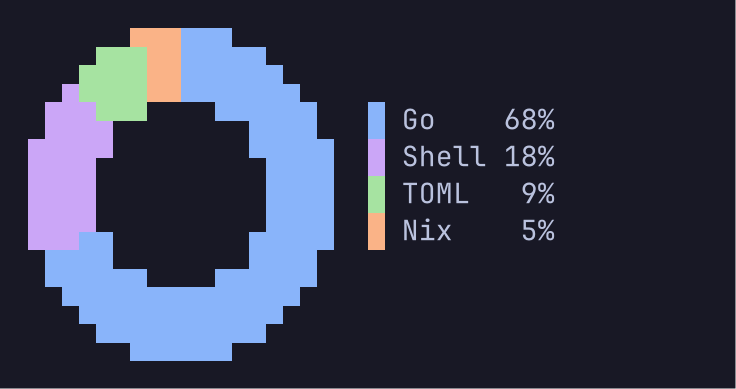
A pie is a disc of half-block pixels. Set Aspect to the height of a cell over its width, and the disc is round. A pie draws 12 slices, and folds the rest into one called "other".
Mirrored bars
net := plot.Mirror{
	Up:     plot.Series{Name: "▼ download", Values: rx, Role: plot.Series3},
	Down:   plot.Series{Name: "▲ upload", Values: tx, Role: plot.Series5},
	Peaks:  true, // • 120M over the highest column of each half
	Stats:  true, // peak · avg · Σ in each corner row
	Format: plot.Compact,
}
grid := net.Draw(56, 10, m)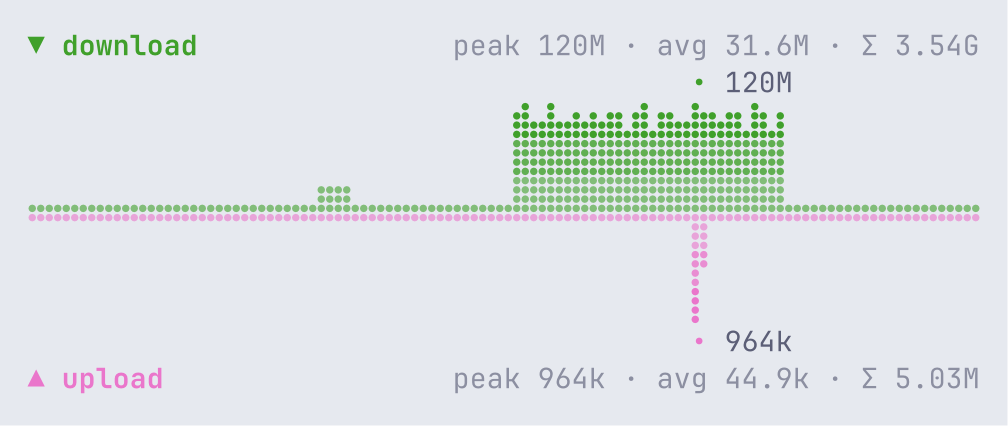
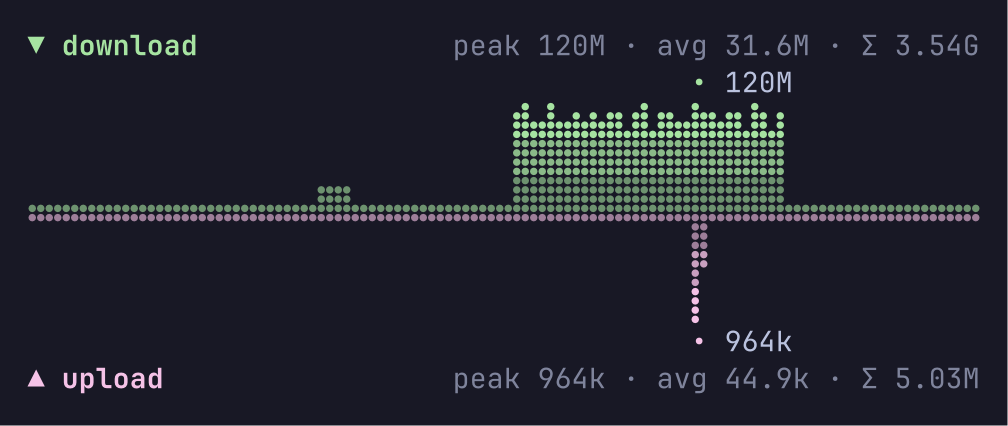
Mirror draws two series around one baseline, such as download and upload, tokens in and out, or reads and writes. Each value is one column of braille dots, and the newest value is at the right edge. Each half scales to its own peak, and Shared gives both one scale. The columns are graded by height with faded roles, such as series3/2. A column with no value shows a dotted track on the baseline.
Credit: the idea and the look come from iptop by franlol (MIT).
Inline bars
hosts := []string{"fra1.example.net", "ams3.example.net", "nyc2.example.net", "sgp1.example.net"}
rates := []float64{30e6, 12.4e6, 3.1e6, 840e3}
grid := plot.NewGrid(44, len(hosts))
for i, h := range hosts {
	grid.Text(0, i, h, plot.Fg, false)
	bar := plot.InlineBar{Value: rates[i], Max: rates[0], Track: true}
	paste(grid, bar.Draw(16, 1, m), 18, i) // the bar column
	grid.TextRight(44, i, plot.Compact(rates[i]), plot.Info, false)
}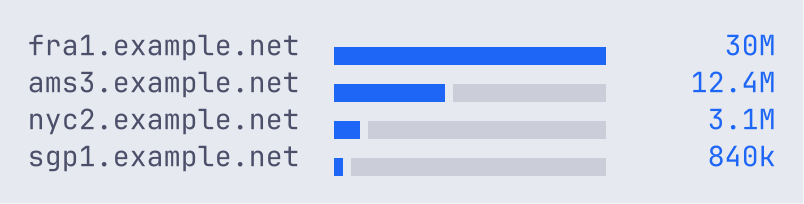
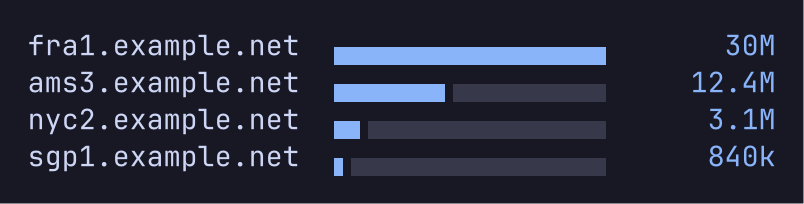
InlineBar is a bar one row high for a table cell. It draws no label, so the cell next to it can hold the value. By default it is a lower half block, exact to half a cell, so the bars of a table stay apart. Style: plot.BarBlocks fills the row with eighth blocks. Give every row the same Max, so the bars compare.
services := []string{"https", "quic", "ssh", "dns", "http"}
down := []float64{24e6, 6e6, 40e3, 900, 1.2e6}
up := []float64{1.1e6, 3.2e6, 220e3, 2.4e3, 9e6}
grid := plot.NewGrid(30, len(services))
for i, s := range services {
	grid.Text(0, i, s, plot.Fg, false)
	bar := plot.DivergingBar{
		Left: down[i], Right: up[i], Max: 24e6, // one Max for every row
		LeftRole: plot.Series3, RightRole: plot.Series5, Track: true,
	}
	paste(grid, bar.Draw(23, 1, m), 7, i)
}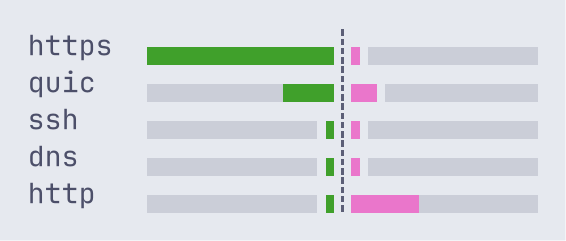
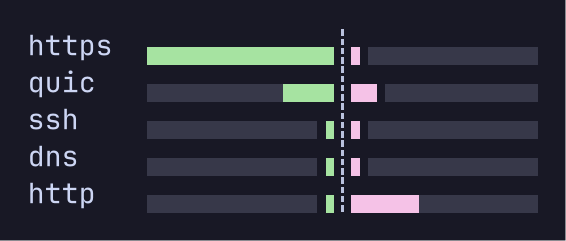
DivergingBar grows left from a centre mark for Left and right for Right.
Credit: the idea and the look come from iptop by franlol (MIT).
World map
world := plot.Map{
	Values: map[string]float64{ // by ISO 3166-1 alpha-2 code
		"US": 410e6, "DE": 120e6, "NL": 95e6, "GB": 60e6, "CA": 35e6,
		"FR": 22e6, "JP": 18e6, "SG": 14e6, "IN": 9e6, "BR": 6e6,
		"AU": 2.5e6, "CN": 1.2e6, "ZA": 400e3,
	},
	Log:     true, // spread values that span orders of magnitude
	Markers: []plot.Marker{{Lat: 52.37, Lon: 4.9}, {Lat: 1.35, Lon: 103.82}},
}
_, rows := world.Fit(72, 40, m) // the rows the map takes at this width
grid := plot.NewGrid(72, rows+1)
paste(grid, world.Draw(72, rows, m), 0, 0)
plot.DrawLegend(grid, 0, rows, world.Legend(m), m) // right under the map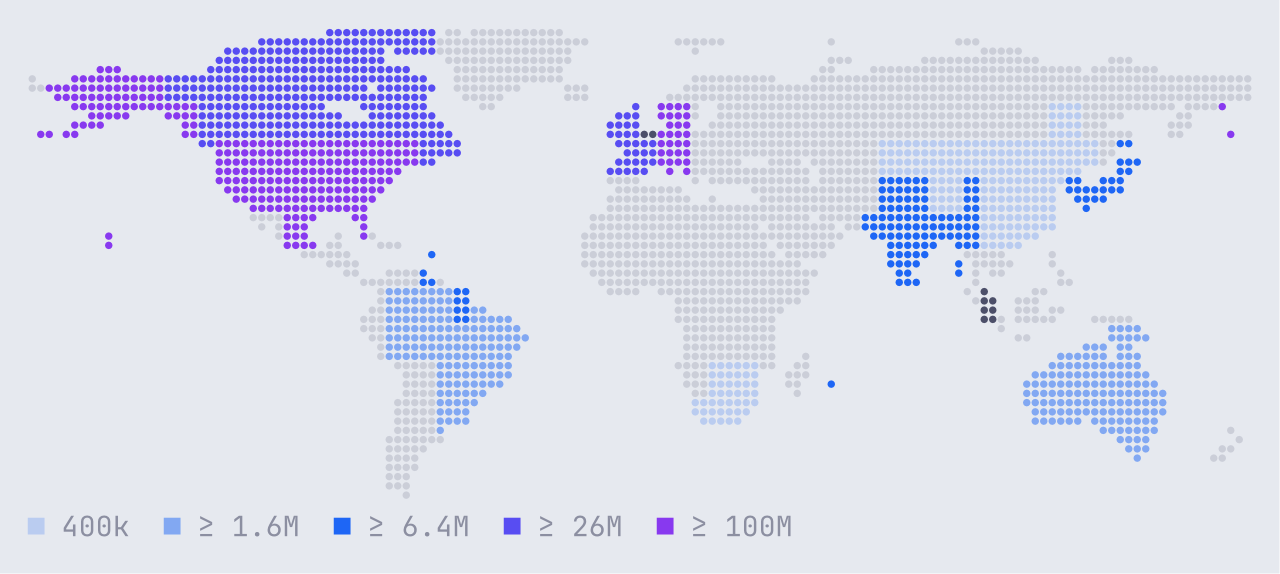
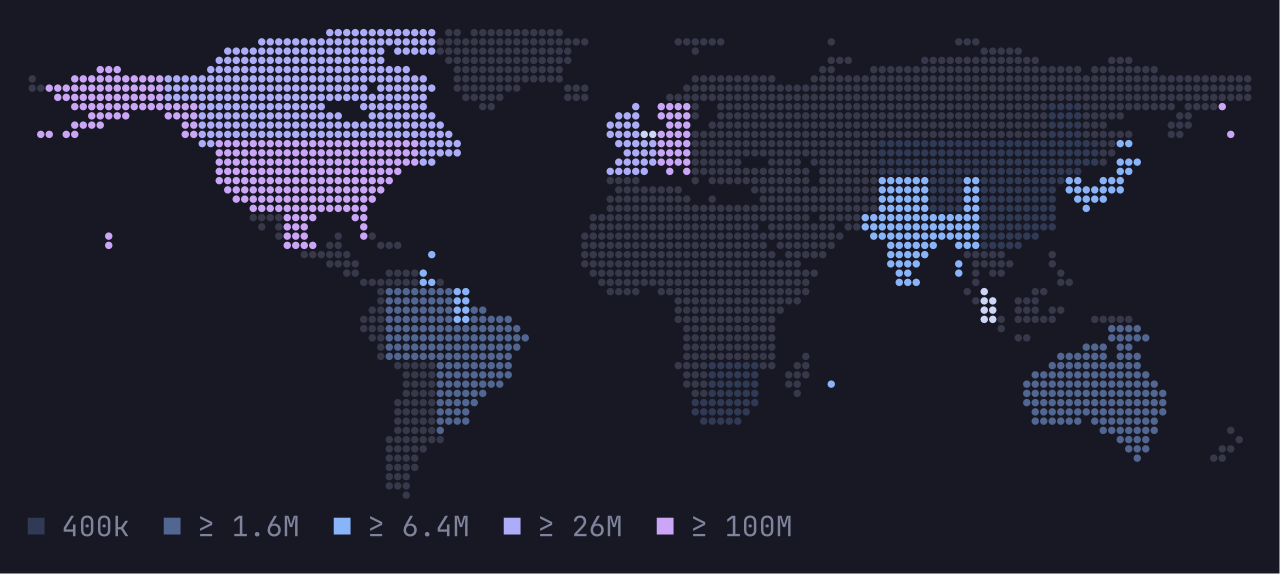
Map draws the land in the track role, and fills each country with a value with a shade of Ramp, heat1 to heat5 by default. Countries are ISO 3166-1 alpha-2 codes. The projection is equirectangular, from 180° W to 180° E and from 84° N to 60° S. The map keeps its true shape and is centred, and fills a box at most a tenth past that shape. Fit returns the cells it takes, so the legend can go right under it. Codes are case-blind, and when two keys name one country the larger value counts. A country that is the larger part of no cell, such as Singapore, takes the cell it covers most, or the nearest free cell, and shows only when it has a value. Legend writes >= in ASCII. A program that draws no map does not link the map data.
Credit: the idea and the look come from iptop by franlol (MIT).
Map data: Natural Earth 1:50m Admin 0 Countries, version 5.1.1, which is in the public domain.
Modes
A mode sets the glyphs a chart can use. Use the best mode that the terminal and its font can show.
| Mode | Lines and areas | Bars, sparklines, gauges |
|---|---|---|
Braille | Braille dots, 2 by 4 per cell | Eighth blocks |
Blocks | Eighth blocks | Eighth blocks |
ASCII | * and : | #, - and [ ] |
The same line chart, sparkline and gauge in each mode:
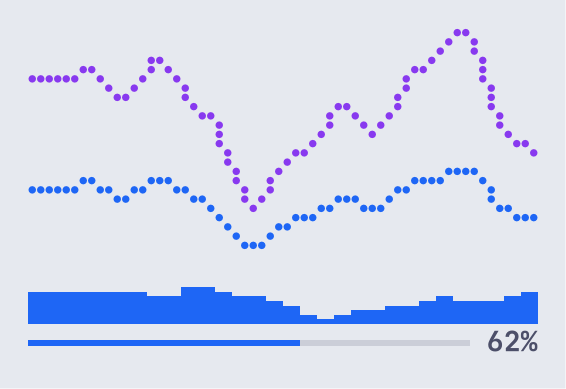
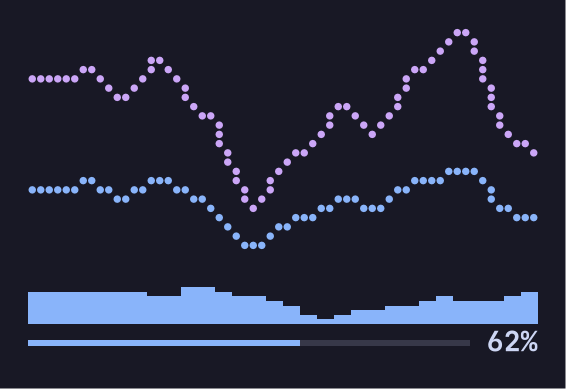
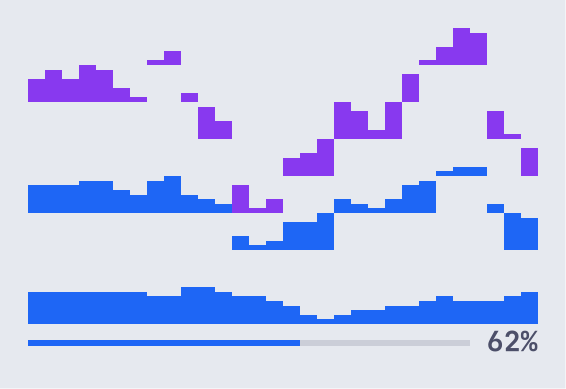
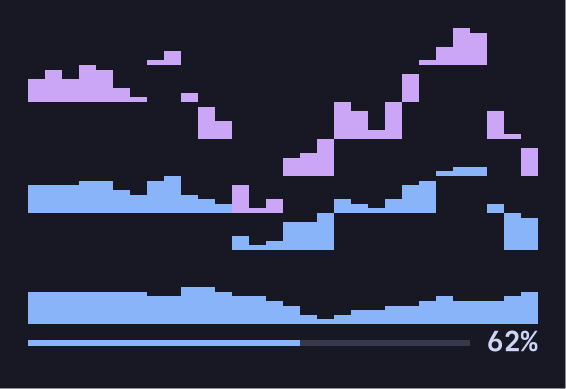
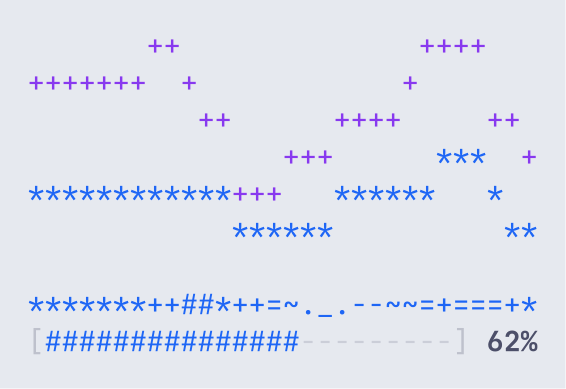
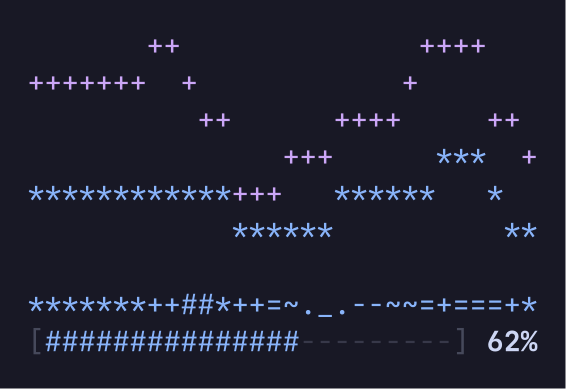
In ASCII, each series, slice and heat level has its own mark, so they stay apart without colour.
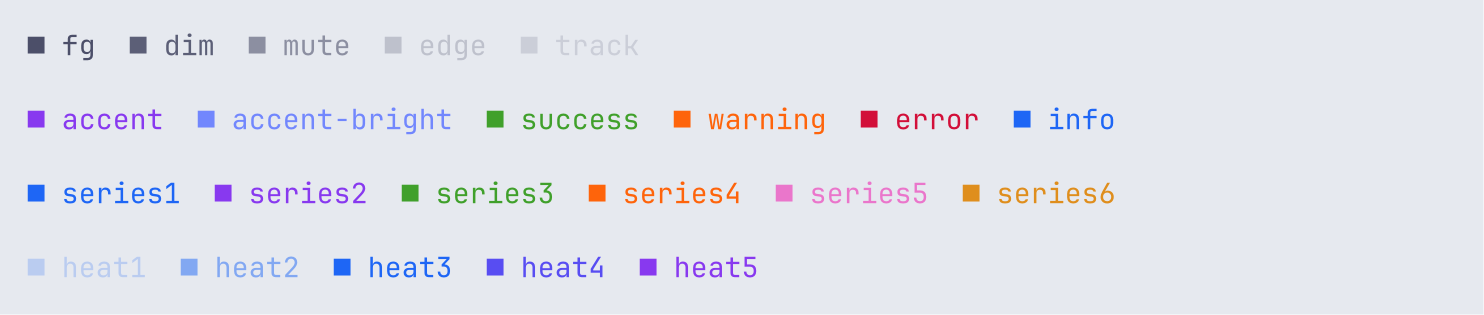
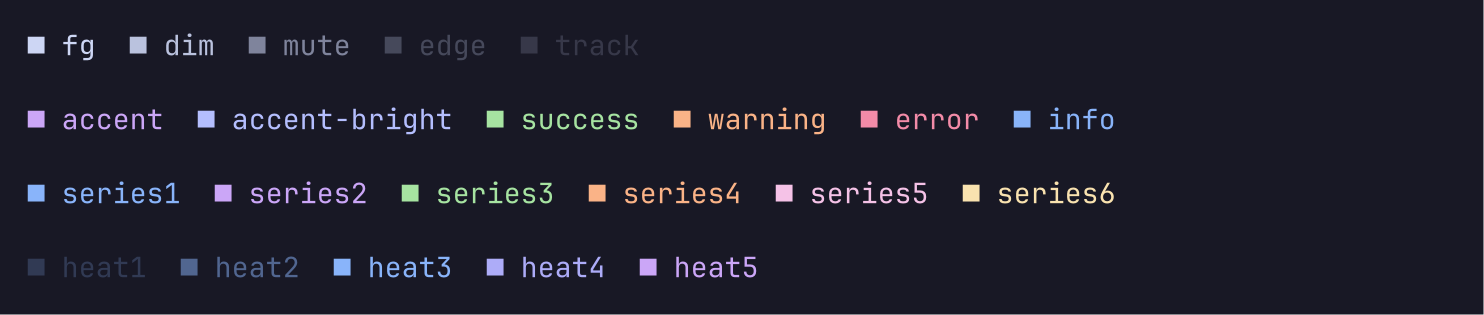
Theme roles
A role names a colour. The names are the TML roles, plus track for the empty part of a gauge or a bar, and heat1 to heat5. plot.Fade(role, k) names a role faded k steps toward the ground, such as series1/2, and Role.Faded splits it. Draw fade k as the base colour mixed about k fifths toward the ground. plot.SeriesRole(i) gives the role of series i, and cycles after six.
How do I
- Fix the range of a chart? Set
MinandMax. Both 0 means automatic. - Format the values? Set
Format, such asplot.Compactor your own function. - Draw a legend? Call
DrawLegend(grid, x, y, chart.Legend(), mode), and give it a row of its own. - Colour one bar? Set
Roles, one role per bar. - Draw a chart in a TML document? Use the chart components through loom, such as
<bar data="state.rows" x="pkg" y="secs"/>. - Print a chart with no colour? Call
grid.String().
API overview
| Name | Does |
|---|---|
Bar | Horizontal bars or columns. |
Line, Series | A line chart, or an area chart with Fill. |
Sparkline | A one-row trend. |
Gauge | A value against a maximum. |
Histogram | Counts of values in bins. |
Heatmap | A grid of values as shades. |
Pie | Shares of a whole, as a donut or a disc. |
Mirror | Two series above and below one baseline. |
InlineBar, DivergingBar | One-row bars for a table cell. |
Map, Marker | A world map with countries shaded by value. |
Grid, Cell, Role | The output of a chart. |
Fade | A role faded toward the ground, such as series1/2. |
Mode | Braille, Blocks or ASCII. |
DrawLegend, Compact, Downsample | Helpers. |
Rules
- Every chart is total. NaN and infinite values count as missing. Empty data draws an empty grid.
- Sizes that a caller could pass unchecked are bounded: a grid is at most 4096 cells a side, and a line draws at most 64 series.
- Labels are cut with an ellipsis to fit. Control characters are dropped, and invalid UTF-8 shows as
?.
Where it fits
- loom uses plot to draw the TML chart components, and maps the roles with its palette.
- tuios draws the charts of
tuios tml showsurfaces with it. - Widths come from
charmbracelet/x/ansi, the same width functions that tuios uses. The package imports nothing else outside the standard library.
Versions
The module is at v0. The API can change between minor versions. Its tags have the folder name as a prefix, such as plot/v0.1.0. The source is in the plot folder of the tuios repository, under the MIT licence.
loom
Draw TML documents into terminal cells. Flex layout, theme roles at every colour depth, redraws of only what a patch changed, and local keys and clicks.
sketch
Mermaid diagrams as SVG, PNG and box-drawing text, in pure Go. A port of pele by kepano.
tuios lives only at tuios.dev and github.com/Gaurav-Gosain/tuios. tuios has no X or Twitter account. An account that offers a tuios token or presale is not this project.