Performance14 min read
Making an idle multiplexer actually idle
An idle tuios client woke about 20 times a second to write nothing, and an idle daemon ran five polling loops. Ten pull requests later the client sleeps until something happens, and the daemon does 1 to 2 context switches a second.
GGGaurav Gosain
Leave tuios open on a shell prompt and walk away. Nothing on the screen changes. Until this week, the client still woke up about 20 times a second, and every one of those wakeups wrote 0 bytes to the terminal. The daemon behind it ran five loops on timers of their own, whatever the panes were doing.
None of that showed up as CPU. The client used about 0.2% of a core, which
rounds to nothing in top. It showed up as wakeups, and wakeups are the thing
a laptop cares about: every one pulls a core out of a deep sleep state. A
terminal multiplexer is the program you leave running all day, often several
of them over SSH, so I wanted idle to mean idle. Here is where it ended up:
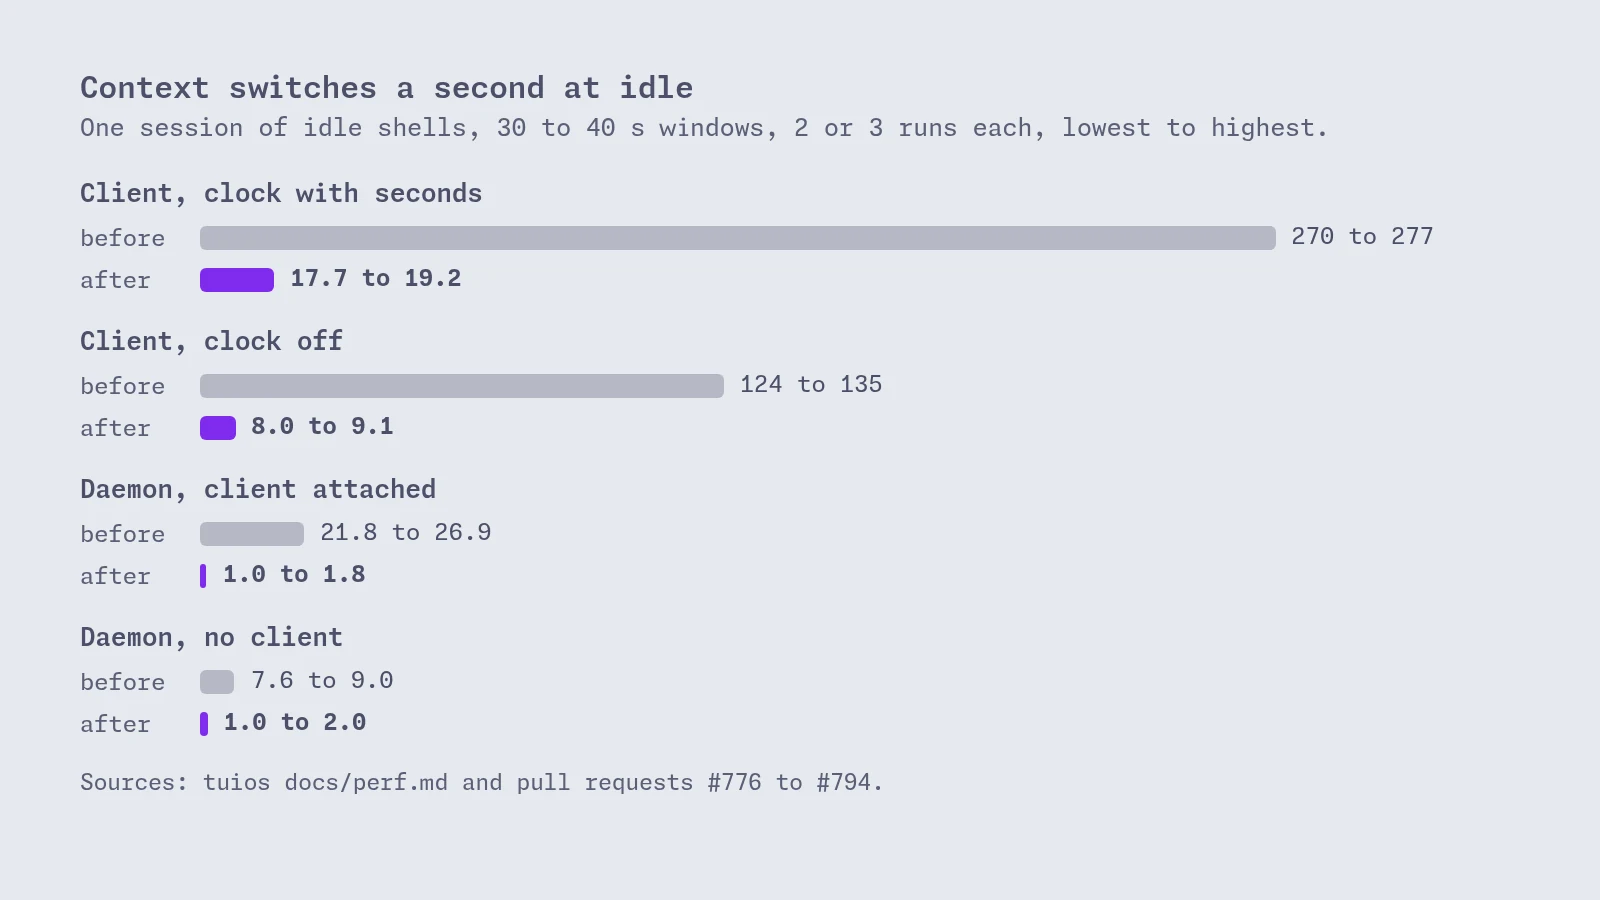
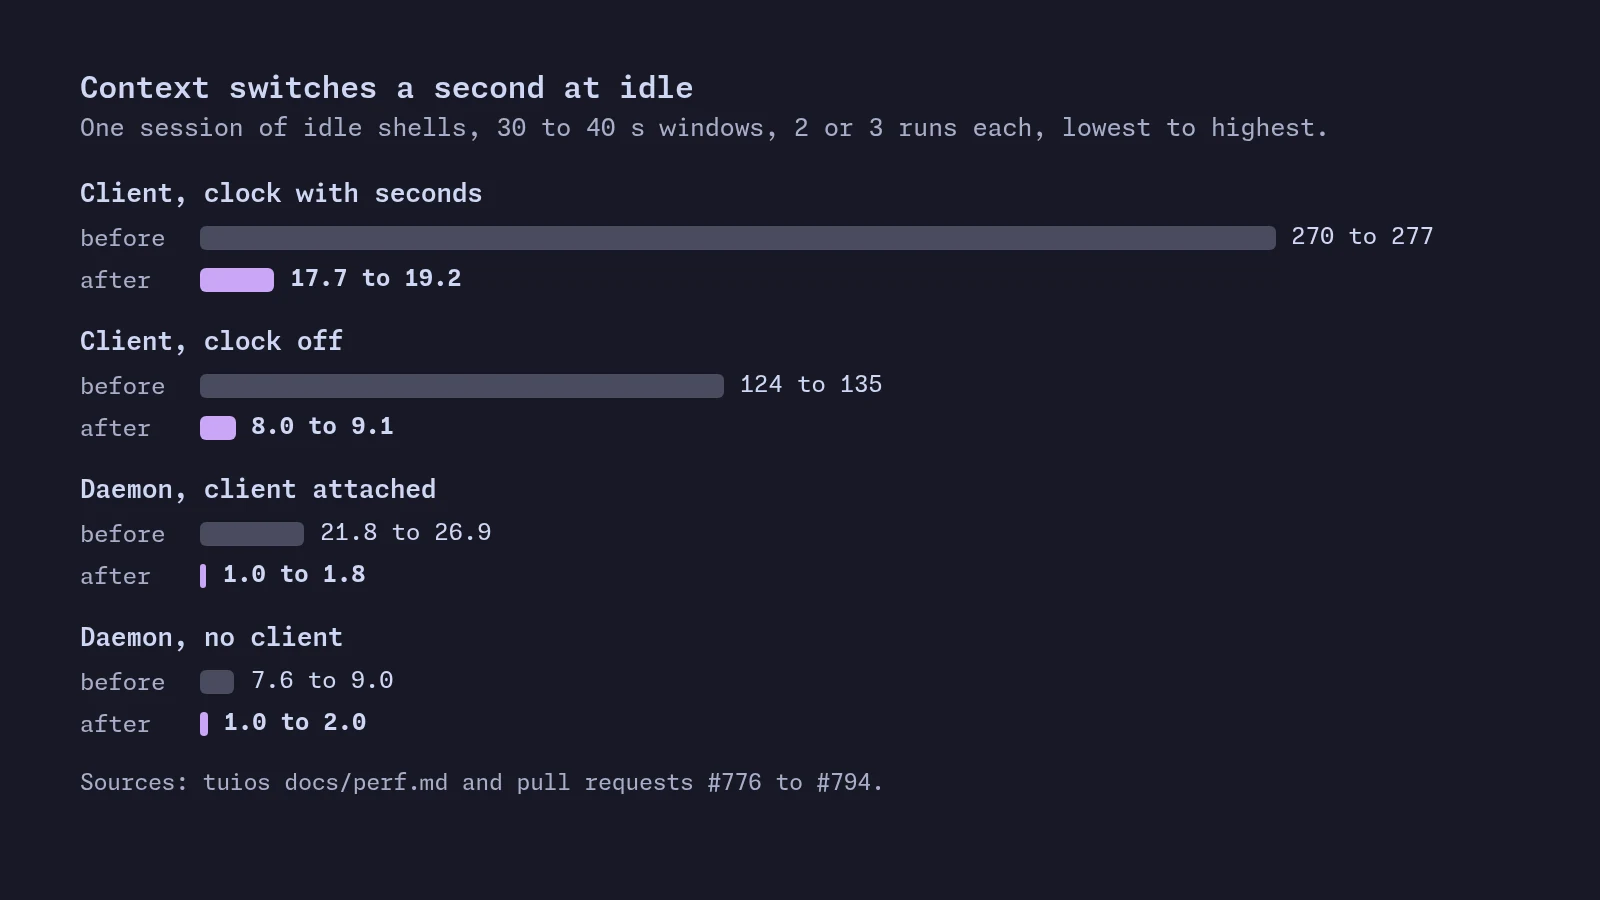
Measuring something that does nothing
CPU percentage is the wrong meter for idle. /proc/<pid>/stat counts CPU in
10 ms clock ticks, so a 50 second run can only resolve 0.02%. Two builds that
differ by a factor of ten in how often they wake can read the same.
What does move is the context switch count. Linux keeps two counters per
thread in /proc/<pid>/task/<tid>/status: voluntary switches (the thread
blocked) and involuntary ones (it was preempted). A Go program has a thread
per P plus sysmon and friends, so I sum them all:
def snap(pid):
    vol = nv = 0
    for tid in os.listdir(f"/proc/{pid}/task"):
        for l in open(f"/proc/{pid}/task/{tid}/status"):
            if l.startswith("voluntary_ctxt_switches"): vol += int(l.split()[1])
            if l.startswith("nonvoluntary_ctxt_switches"): nv += int(l.split()[1])
    return vol + nv
Take a snapshot, sleep 30 seconds, take another, divide. The harness around
it starts a throwaway daemon with two bash panes and attaches a client inside
a detached tmux. Everything runs under nice -n 19 taskset -c 0-7 with
GOMAXPROCS=4, because this machine is shared, and builds are interleaved so
that background load hits both sides of a comparison.
A count tells you how much. It does not tell you who. For that:
runtime/trace, grouped by the stack each goroutine was blocked in when it woke. A goroutine parked instartPeriodicSaveWith.func1waking 0.5 times a second is a 2 second ticker, and the stack names it.strace -fon the daemon, to see what each wakeup did. One of them read/proc/<pid>/statevery 2 seconds, forever.
Both tools showed how much a single timer costs. A Go timer firing at idle is not one context switch. The netpoller thread wakes, the goroutine runs, and then sysmon spins in 20 µs sleeps before it parks again. On the daemon, each timer wakeup turned into 10 to 40 context switches. On the client, 20 timer wakeups a second came out as about 130 context switches a second.
The client: twenty wakeups to draw nothing
The client had two 10 Hz timers and one slow poll:
| Source | Wakeups/s | Bytes written |
|---|---|---|
Bubble Tea's frame ticker, at IdleFPS | 10.00 | 0 |
tuios's maintenance tick, at IdleFPS | 10.00 | 0 |
| Session listing poll, rail open | 0.33 | 0 |
The maintenance tick checked for things like a pane whose process exited or a toast that should expire. At idle, a gate already skipped every scan. But look at what the gate did after deciding there was nothing to do:
if !m.tickNeedsWork() {
	m.renderSkipped = true
	return m, IdleTickCmd()
}
It found no work, and then it booked the next tick 100 ms later. Each of those ticks woke four goroutines on the way through Bubble Tea's event loop. The work was gone. The wakeup stayed.
The frame ticker was the other half. Bubble Tea flushes frames from a
time.Ticker that runs for the life of the program. tuios already dropped it
to 10 frames a second after 500 ms with no new frame. Each tick then found the
view unchanged and wrote nothing.
A clock that cost thirty frames
Before going after the 10 Hz timers, one smaller thing. With show_clock
turned on, the dock draws one frame a second, which is fine. But every frame
called noteFrame, which wakes the frame ticker back to the full frame rate
for 500 ms in case more frames follow. At 60 fps that is about 30 frame ticks
of nothing for every clock frame. With the clock on, the frame ticker fired
40.4 to 41.4 times a second.
A frame that only the dock asked for now goes out once through kickFlush
and leaves the ticker alone (#781).
Frame ticker fires with the clock on went to 11.0 a second, and context
switches halved, from 270 to 277 down to 142 to 145.
Stopping a ticker Bubble Tea does not let you stop
Bubble Tea v2 has no "render when I say so" mode, and I did not want to fork it. But tuios already reached into the program to change the frame rate at runtime, so the ticker was right there:
func programTicker(p *tea.Program) *time.Ticker {
	tick := reflect.ValueOf(p).Elem().FieldByName("ticker")
	if !tick.IsValid() || tick.Type() != reflect.TypeFor[*time.Ticker]() {
		return nil
	}
	return *(**time.Ticker)(unsafe.Pointer(tick.UnsafeAddr()))
}
Yes, it's reflection on an unexported field. TestSetProgramFPS fails on a
Bubble Tea release that renames it, and if that happens tuios falls back to
the old behaviour instead of crashing.
So the idle switch now calls ticker.Stop() instead of slowing it down
(#782). Three things made
that work:
noteFramealready calledticker.Resetto speed the ticker up for a burst of frames.Resetrestarts a stopped ticker, so the wake path did not change.- Bubble Tea writes some things only from that ticker, such as a clipboard set. So while the ticker is stopped, tuios asks for one flush after every message. Messages are rare at idle, so that costs almost nothing.
- Go 1.23 changed timers so that
Ticker.Stopalso empties the channel. A kick sent just before the stop would be thrown away, with nothing left to send another. So the stop is followed by one more tick:
ticker.Stop()
// Since Go 1.23, Stop also empties the ticker's channel, so a kick that
// kickFlush sent just before it and the renderer has not taken yet would be
// lost with nothing left to send another.
sendTick(ticker)
fr.idle = true
With the clock off, frame ticker fires went from 10.0 to 0.33 a second. The 0.33 left over is the flush after each listing poll.
A tick that only runs when a job is due
The maintenance tick was the last 10 Hz timer
(#787). Every job now says
when it is next due, and the client arms one timer for the earliest of them.
nextWake runs after every message:
func (m *OS) nextWake(now time.Time) (time.Time, bool) {
	if m.tickAtFrameRate() {
		return now.Add(m.framePeriod()), true
	}
	var due time.Time
	at := func(t time.Time) {
		if due.IsZero() || t.Before(due) {
			due = t
		}
	}
	// Alerts held back go out at their due time.
	for _, p := range m.pendingAgentAlerts {
		at(p.due)
	}
	// ... the message burn, the zen reveal, the frame ticker's idle switch,
	// the git section's next reading, and the rest
With nothing due, it returns false and no timer is armed. The client then sleeps until a message arrives: a key, pane output, a push from the daemon.
The risk with this kind of change is a job that used to ride the tick and that nobody put on the list. It would not crash. It would freeze until the next keystroke, which is much harder to notice. So before merging I ran a scratch build that also ran the old gate every 100 ms in the background, and logged any work it found that no armed deadline covered, three looks in a row. It ran the whole e2e suite, 1,256 tests over 7 shards. Every hit was either a sticky error message, which needs no tick, or pane output already on its way in its own message.
| Client, one idle shell | CPU | context switches/s |
|---|---|---|
| before #781, clock off | 0.20 to 0.22% | 124 to 135 |
| after #787, clock off | 0.04 to 0.06% | 8.0 to 9.1 |
before, clock on (15:04:05) | 0.40 to 0.56% | 270 to 277 |
after, clock on (15:04:05) | 0.16 to 0.18% | 17.7 to 19.2 |
With everything else asleep, a clock showing seconds was most of what a
client with the clock on cost. So the default clock format is now 15:04
(#790), which wakes the
client once a minute instead of once a second: 0.02% CPU and 6.7 to 7.5
context switches a second. 15:04:05 still works if you want seconds.
That one had a catch I nearly missed. A Go timer counts time the machine is awake. Arm a 59 second timer, suspend the laptop for an hour, and on wake the clock shows the old time for up to 59 more seconds. The dock now rereads the wall clock at least every 15 seconds, and a focus report from the terminal makes it reread at once.
Did it get slower to wake up?
Sleeping deeper is no good if the first frame after idle comes late. The probe
for this is a pane program that sleeps, takes the time, and writes a marker,
all in one process. The latency is the time until that marker reaches the
outer terminal through tmux pipe-pane. After 20 seconds of idle, over 20 runs:
1.4 to 1.8 ms, against 1.4 to 1.6 ms over 10 runs on the old build.
The daemon: five loops that polled
The daemon owns the PTYs, so it has real background work. Each job was a loop on a ticker:
| Loop | Interval | Wakeups/s at idle |
|---|---|---|
| Resurrection saver, per session | 2 s | 0.5 per session |
| Agent monitor | 2 s | 0.5 |
| Stall monitor | 7.5 s at the default timeout | 0.13 |
| Cleanup loop | 30 s | 0.03 |
| Session listing, asked by a client with the rail open | 3 s | 0.33 per client |
The resurrection saver woke every 2 seconds to check a dirty flag, and every
30 seconds it wrote the same state to disk again whether anything changed or
not. The agent monitor was the one strace caught reading /proc/<pid>/stat
every 2 seconds. A daemon whose panes sat at a prompt did 7 to 9 context
switches a second alone, and 22 to 27 with one client attached.
A latch instead of a ticker
All four loops got the same fix, built on one small type (#776):
type wakeLatch struct {
	up atomic.Bool
	c  chan struct{}
}

// Set raises the flag and wakes the loop if the flag was down.
func (l *wakeLatch) Set() {
	if l.up.Load() {
		return
	}
	if l.up.CompareAndSwap(false, true) {
		select {
		case l.c <- struct{}{}:
		default:
		}
	}
}
The code that notices a change calls Set. The loop blocks on the channel
while it has no work, and lowers the flag when it does the work. The important
part is the first Load. Set sits on hot paths, such as every chunk of
output a pane prints, and while the flag is already up it costs one atomic
load and nothing else. Only the edge from down to up sends a token, and the
channel holds one, so a pane printing 100 MB wakes the loop once.
Then each loop got rules for when it really has work:
- The saver (#776). A structural change (a pane opened, a split, a rename) reaches disk within 2 seconds, as before. Output marks the session stale, and a stale session is written within 30 seconds of the last save. A session that prints nothing writes nothing.
- The agent monitor (#777). A program can only start or stop in a pane that takes input, prints, or was just made. Each of those raises the latch. After 10 quiet seconds the monitor stops its timer.
- The stall monitor (#778) sleeps until the earliest working pane could stall. With no agent working, it arms nothing.
- The cleanup loop (#779) runs at most twice after the last output, input or resize.
A push for the listing
That left the listing poll. A client with the rail open asked the daemon for every session, every 3 seconds, to draw the other sessions on the rail. Most of those answers were the same as the last one.
Everything the listing shows changes through an event the daemon already
sees: output, input, a state change, a title, a folder, a client arriving or
leaving. So each of those raises one more latch, and a notifier builds the
listing, hashes it, and sends MsgSessionsChanged only when the hash moved
(#794). It looks at most
once every 3 seconds, the old poll rate, so a busy session costs no more than
before. An idle one costs nothing. An older daemon that does not offer the
push is polled as before.
Context switches a second, 40 seconds after the panes opened, three interleaved runs each. The last row comes from a later set of runs:
| Build | Daemon alone | Daemon, client attached |
|---|---|---|
| before | 8.1, 9.0, 7.6 | 26.9, 24.8, 21.8 |
| four loops sleep | 1.0, 2.0, 1.0 | 11.0, 7.7, 15.5 |
| and the listing push | 1.4, 1.0, 1.8 |
What is left is the Go runtime: sysmon, and the forced GC every 2 minutes. No
timer of tuios's own fires while nothing happens. TestDaemonIdleArmsNoTimers
holds that: it starts a real daemon, waits for the loops to settle, and allows
0 timer fires over an idle window.
Busy, but not here
A workspace you are not looking at still has panes that ring the bell or print, and since this week the dock can mark those tabs. A client streams only the panes it shows, so the daemon has to tell it. Telling it about every chunk would let a build log in a background workspace wake the client hundreds of times a second for a mark that is already on screen.
So the mark is edge-triggered, like the latch (#837). Each pane keeps one atomic bit per mark. The first output after a client stops looking sets the bit and sends one message. Every later chunk does this and returns:
func (p *PTY) raisePaneMark(mark uint32) bool {
	if p.paneMarks.Load()&mark != 0 {
		return false
	}
	return p.paneMarks.Or(mark)&mark == 0
}
BenchmarkPaneMarkRaised puts that at 2.1 ns a chunk with 0 allocations. A
pane out of view that prints 16 MiB sends the client 0 marks after the first.
The bytes that do go out
While profiling the frames that do write something, I found a renderer bug in ultraviolet, the cell renderer under Bubble Tea v2.
putRange follows ncurses' PutRange: when a line changed, write the
changed cells, and jump over a run of unchanged ones once the run is longer
than a cursor move costs. The check compared the run with the whole range
instead:
 			if cellEqual(oldCell, newCell) {
 				same++
 			} else {
-				if same > end-start {
+				if same > inline {
 					s.emitRange(newbuf, newLine[start:], j-same-start)
A run inside a range can never be longer than the range, so the jump never happened. A line that changed only at its two ends was rewritten from the first change to the last, on every frame. That is what a progress bar with a counter at the far end does. On a one-row screen where only the first and last cells change:
| Width | Before | After |
|---|---|---|
| 80 | 91 B | 18 B |
| 200 | 211 B | 19 B |
The fix is charmbracelet/ultraviolet#218, with a test that fails without it. It is still open as I write this, so tuios does not have it yet. It matters most over SSH, where every byte of a frame crosses the network.
What it costs
Here is the bill.
- Behaviour. An agent started in a pane with no output and no input, more than 10 seconds after the last activity, is now found when its pane next prints, not within 10 seconds. Every agent harness tuios knows prints when it starts, so I took the trade.
- A visible default. The clock lost its seconds. One line of config brings them back.
- Fragility. Stopping the frame ticker depends on reflection into Bubble Tea. A test catches a rename, and the fallback is the old 10 Hz. The proper fix is a render-on-demand option upstream.
- Per message.
nextWakenow runs after every message.BenchmarkIdleTickmeasured 689 to 714 ns a tick, within the noise, and allocations dropped from 5 to 1 because no timer is armed. - Bytes. The daemon stack added 24,576 bytes to the linux/amd64 binary and 33,616 to darwin/arm64. Small, but tuios has a binary size budget, and this crossed a 16 KiB page on darwin, so the budget raise went in as its own commit.
I have not measured battery life, and I am not going to quote a battery number I have not measured. Every SSH or web client runs the same model, so each one saves the same again.
One thing I left alone: by reading the code, ultraviolet's console reader peeks the console every 10 ms when there is no input. That would be about 100 wakeups a second on a local Windows console, five times what this work removed. I have not measured it, and the fix belongs upstream.
The tests that hold all of this are the boring part, and the part that keeps
it true. TestIdleCostStaysLow boots the real binary, idles for 10 seconds,
and allows 2 maintenance ticks and 400 voluntary context switches. The build
before this work did 100 ticks. Put the old 10 Hz tick back and it fails with
"handled 100 maintenance ticks (budget 2)". The next feature that adds a
polling loop will meet that test first.